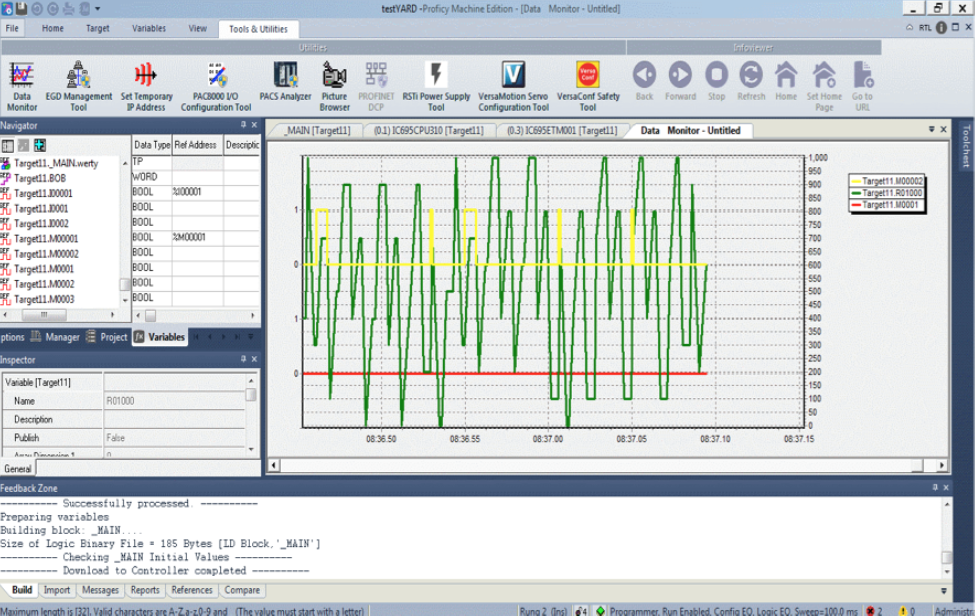
Taking advantage of the visual representation provided by Proficy Machine Edition, the Graphical Data Monitor allows a user to easily diagnose issues generated by connected equipment. Values such as state and time are displayed on a single display to quickly assess and analyse to assist in troubleshooting, tuning and deployment.
Let’s get started.
Step One
For a fast connection and result, connect to the controller via an Ethernet interface. Your variable values will be refreshed quickly.
Step Two
Open the “Tools and Utilities” tab and click on “Data Monitor” to bring up the tool. Click on the Navigator Window’s Variable tab to display the variable list.
Step Three
Now simply select the desired variable (format doesn’t matter) and drag this across to the Data Monitor window. This will be displayed on the right-hand side with a legend of corresponding colours.
